See what happened.
Know what's next.
Traditional analytics explains yesterday. We build decision intelligence architectures that predict forward outcomes, generate automated narrative insights, and empower leaders to act early with total clarity.
Q4 SKU Volume Expected at 482,000 units (+14.2% YoY)
Leading indicators: macro indices, freight lag, historical promotional elasticity
Move from hindsight to foresight.
Having more terabytes of data does not automatically create better decisions. When teams rely strictly on historical dashboards, they are driving by looking in the rearview mirror.

Unified Ingestion
Continuous streaming from ERP, CRM, IoT sensors, and transactional ledgers without batch latency.
Analytics that think beyond the dashboard.
A chart can indicate that quarterly sales softened. AI-powered analytics diagnoses the exact underlying factors, calculates the projected trajectory, and prescribes corrective actions.
Predictive Intelligence & Forecasting
Multivariate machine learning models analyzing historical trends, macroeconomic shifts, and real-time operational signals to forecast demand, revenue, and customer behaviors before they occur.
Pattern & Anomaly Detection
Intelligent background scanners continuously monitoring data streams to isolate subtle statistical deviations, fraudulent transactions, equipment fatigue, and supply bottlenecks.
Customer Intelligence & Retention
Synthesizing multi-channel customer touchpoints to decode purchasing intent, engagement lifecycles, and emerging churn indicators, prescribing targeted retention actions.
Automated Insights & Natural Summaries
Eliminating manual slide preparation with AI that detects major metric variances, explains underlying drivers in plain English, and distributes tailored briefing cards.
Embedded Decision Intelligence
Surfacing prescriptive recommendations directly inside enterprise operational systems—Salesforce, SAP, ServiceNow, Slack, and dispatch consoles.
Conversational Query Interfaces
Empowering business users to query complex data warehouses using natural language. Ask questions, explore root causes, and simulate scenario outcomes without writing SQL.
34 Accounts Flagged (ARR at Risk: $4.2M)
Login decay (>40% drop over 30 days) and 3 unresolved Tier-1 ticketing incidents correlate with 91% churn probability.
Auto-dispatched high-touch executive check-in and prioritized SLA escalation queue.
Intelligence designed for every decision-maker.
Different roles require different context. We engineer tailored analytical experiences for each tier while maintaining a unified, single source of truth underneath.
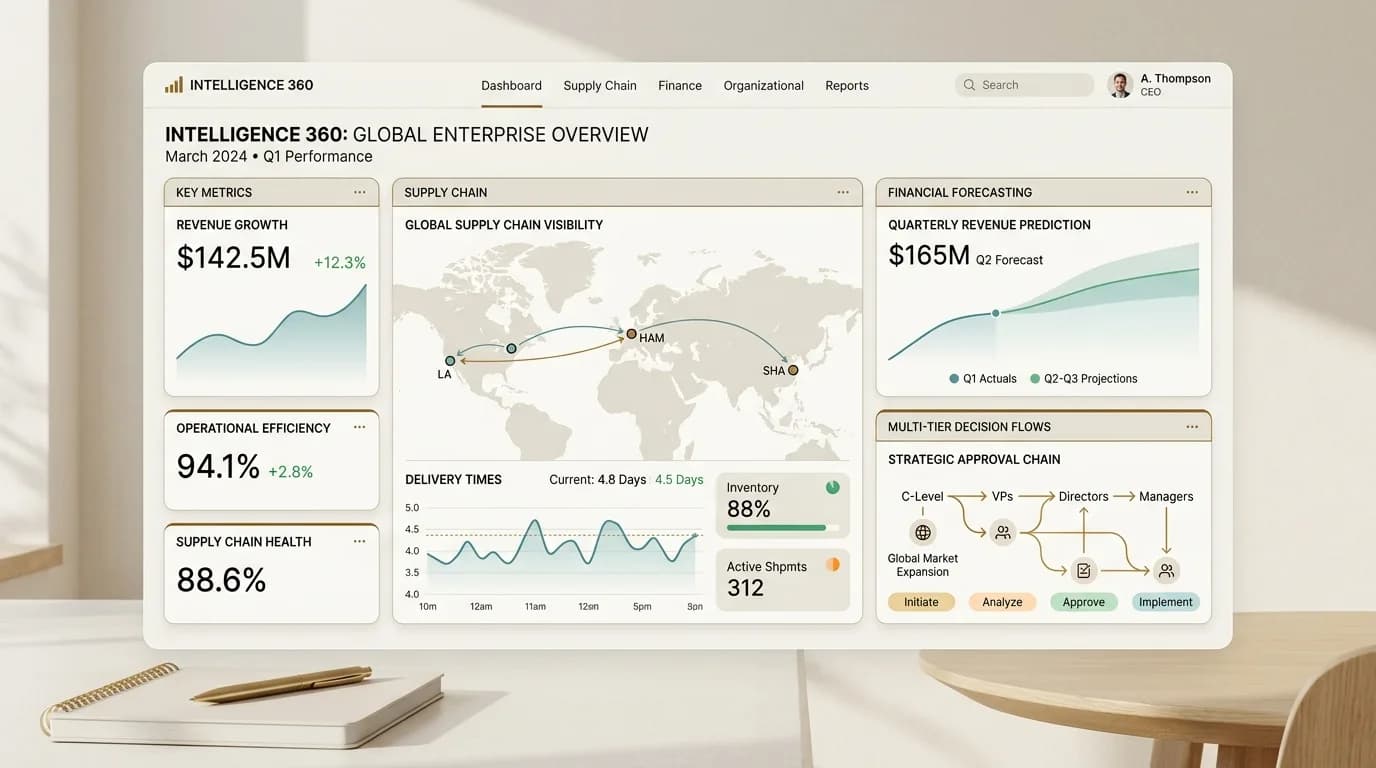
Real-time enterprise cockpit showing consolidated P&L variance, multi-year forecast cones, and capital risk exposure.
AI analytics across critical market sectors.
Pre-trained analytical models and domain logic configured for the specific dynamics of your industry. Select a vertical below to inspect active analytical conduits.
Financial Services
Predictive credit underwriting, algorithmic fraud scoring, dynamic portfolio risk stress-testing, and automated regulatory filing.
From reactive reporting to proactive foresight.
Experience the contrast between slow, backward-looking charts and automated predictive intelligence.
Structured path from questions to production intelligence.
A disciplined, 8-phase methodology ensuring analytical models remain statistically rigorous, explainable, and aligned with measurable ROI.
Map critical commercial decisions, key hypotheses, and high-impact questions across executive stakeholders.
Measure analytics by business impact.
We measure our work by the commercial impact on your P&L—not simply the number of charts created.
From weekly lagging slide compilations to real-time automated insight feeds.
Sharply reduced variance across revenue, SKU demand, and cash projections.
Automated narrative generation eliminates repetitive slide assembly.
Proactive account health scoring flags friction 60 days before contract renewal.
Instant statistical filters isolate fraud and bottlenecks before escalation.
Direct gross margin gains realized through optimized inventory and pricing.
We build intelligence that drives action.
Combining statistical data science, cloud engineering, enterprise systems integration, and human-centered design.
Decisions Over Dashboards
We focus on the decisions that drive commercial value—not merely assembling another passive chart.
End-to-End Synergy
We connect data engineering, machine learning pipelines, and user interfaces into a unified workflow.
Explainable & Auditable AI
Every model recommendation and anomaly alert provides clear, interpretable factor drivers.
Seamless Systems Integration
We push intelligence straight into Salesforce, SAP, Teams, Slack, and existing corporate portals.
Enterprise Security & Governance
Granular role-based access, automated metadata tracking, and SOC2/GDPR compliance built in.
Built for Continual Evolution
Self-monitoring pipelines detect model drift automatically, keeping predictions fresh and accurate.
Frequently asked predictive analytics & telemetry questions.
Concrete data on predictive versus historical BI, pre-failure equipment anomaly detection (14-30 days advance warning), causal inference, and automated ops alerts.
Standard BI reports historical data (what happened). Waypoint predictive telemetry applies multivariate time-series models and causal inference to forecast what will happen next, quantifying operational risk and prescribing optimal interventions.
Ready to turn your data into a decision-making advantage?
Your business data already contains critical predictive signals. We will help your organization discover them, understand them, and act on them before anyone else.